4. PROCESSING OF A SEQUENCE
OF Be STARS SPECTRA
![]() Pour une version en français
de ce texte, cliquer ici.
Pour une version en français
de ce texte, cliquer ici.
(December
2001)
This chapter describes the various stages of the processing of spectra obtained with the Littrow " high-resolution " (dispersion of 0.38 angstroms/pixel, for a spectral FWHM resolution of 0.9A towards 6500A, and so, a resolution power of 7000 around this wavelength). The sequence is adapted to the study of the Be stars in the optics of the systematic program of monitoring and measurement over a long period of time.
The course of the sequence is illustrated by the processing of the Be star HD169033 (AD=18H23.2m, DEC = -12°01 ') V=5.73 magnitude and spectral type B8IV/V. The observation was carried out in Castanet-Tolosan (southern of Toulouse) under good conditions of transparencies with the spectrograph assembled to the Newton focal plane of a CN-212 Takahashi telescope (F/D=3.9). It was obtained 13 successive images of this object each one exposed 120 seconds the 19 May 2001. The spectrograph is used in broad slit mode (5 mm wide). The acquisition software is Pisco and the camera is an Audine equipped with a CCD Kodak KAF-1602E.
The preprocessing of the images is carried out with the Iris software up to the extraction of the spectral profile, then VisualSpec is used for all that relates to the operations of calibrations.
4.1. Preprocessing (manual method)
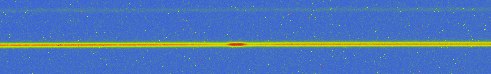
The image hereafter shows (false-colors) one of the 13 rough spectra of HD169033. For the representation, the spectrum was compressed along the two axes with a factor 0.39. The wavelengths go increasing from left on the right. One can see at the center, a little on the left, the line Ha in emission. On the right edge one finds the B band of atmospheric absorption caused by the molecule O2. The covered spectral field goes from 6300 A to 6900 A approximately.
![]()
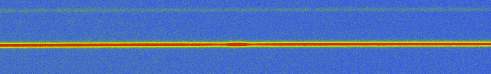
Below is the detail of the one of the rough spectra at the original scale and centered on the hydrogen line.
To carry out the processing we take an image of the offset signal with the name OFFSET (see the image below). It is the median composite of 13 images carried out in the darkness at the minimal exposure time allowed by the camera. If O-1, O-2, O-3... O-13, are the acquired images, we run the following commands from the console of Iris:
SMEDIAN O- 13
SAVE OFFSET

The image of the thermal signal named DARK (see below) is the result of the median composite of 9 exposure of 120 seconds carried out in the darkness (command SMEDIAN). As a preliminary, the signal of offset was subtracted from each of the 9 images (command SUB2). If N-1, N2... N-9 are the acquired images of dark, the treatment sequence is then:
SUB2 N- OFFSET I 0 9
SMEDIAN I 9
SAVE DARK

The third image necessary to the preprocessing is the flat-field image, which is the map of relative sensitivity of each point of the image. The realization of a flat-field image is always a delicate operation in spectroscopy. The image hereafter, which we compare to a flat-field (called image FLAT) is a spectrum obtained in the twilight.

The dust deposited on the surface of the CCD sensor is perfectly visible in the form of aureoles. One notices also optical vignetting (the contrast of this image is high for the purpose of the visualization). The problem is that the recorded signal is not only function of the local transmission of the instrument, but also of the spectral contents of the scene observed, here the background of the sky in the twilight. Image FLAT is thus not exactly a flat-field. Fortunately, it makes it possible to satisfactorily correct the shade of dust and in certain extend the slow variations of the optical vignetting.
The skew introduced by the dependence of the intensity regarding the wavelength into the FLAT image will be eliminated at the time of the radiometric correction (see further). It should be stressed that the flat-field would be more correct if it is obtained at the zero-order (direct image of the sky on the CCD without spectral dispersion), but this were not possible on the tested prototype, but is corrected thereafter. To be noted: the use of a flat-field carried out at the zero-order to correct the spectra is possible thanks to the adoption of the Littrow assembly, because this one does not produce a phenomenon of anamorphosis (dust has the same scale at the zero-order than at the order 1 because equality between mean incident angle and mean diffractive angle on the grating).
Fourteen elementary images flat-field were carried out in the twilight with a variable exposure time making it possible to cover the 3/4 of the dynamics of the camera. Their name is F-1, F-2... F-14. The signal of darkness is adjusted automatically with these images (command OPT2), then subtracted. Then, we also subtracted the offset signal. The 13 images are then standardized at the level of 25000 ADU , the median intensity, then the median sum of the whole sequence is done. Here is the command sequence:
OPT2 F- DARK I 14
SUB2 I OFFSET
I 0 14
NGAIN2 I I 25000 14
SMEDIAN I 14
SAVE FLAT
Once the 3 reference images of reference acquired and processed (OFFSET, DARK, FLAT) the preprocessing of the spectra is done in a traditional way. If 16903-1, 16903-2..., 16903-13 are the names of the images of the sequence of raw spectra, one makes:
OPT2 16903- DARK I 13
SUB2 I OFFSET
I 0 13
DIV2 I FLAT I 25000 13
The processed sequence is then I1, I2..., I13.
Here is the result for one of the images of the sequence:
The fine analysis shows that the spectra are slightly curved. This problem will be dealt with later. Moreover it appears that the average axis of dispersion is tilted +0.1°compared to the horizontal axis of the CCD This is a slight imperfection of orientation of the grooves of the grating compared to the axes of the CCD. It is now time to correct this small defect by applying a rotation on each image relative to the mean center of the spectra (coordinated 840, 50 in the example):
ROT2 I I 840 50 0.1 13
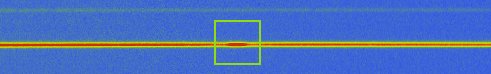
The next step consists in registered along the two axes the spectra I2, I3..., I13 so that they superimpose exactly on the spectrum I1. The operation is done in an automatic way with the command L_REGISTER if it is possible to observe a common significant detail on each image. It is well the case here. One can be used either an emission line, or an absorption line. It is necessary for that to manually select with the mouse the line in the first spectrum of the sequence (see image below), then to run the command:
L_REGISTER I J 1 15 13
The third parameter (value 1 here) indicates to the program that the line is in emission (for an absorption line it is necessary to set 0). The fourth parameter is the width in pixel on which is calculated the barycenter of the line. This command produces the registered sequence J1, J2..., J13.
Goto index page Previous page Next page