C/2001 A2 (LINEAR) SPECTRAT
Observatory location: Pic du Midi Observatory
Observateur: Christian Buil (Aude association)
Spectr'aude spectrograph conception and realization: Christian Buil, Francois Colas, Robert Delmas and Thierry Maciaszek.
Equipment description:
Refractor FSQ-106 - F/D=5 (Takahashi)
Mount: Vixen
GP-DX
Spectr'Aude
spectrograph (click here for details)
Dispersion of 8 angstroms/pixel (bin 2x2)
CCD camera: Audine KAF-0401E
Acquisition software: Pisco
Preprocessing software: Iris
Spectral analysis
software: VisualSpec
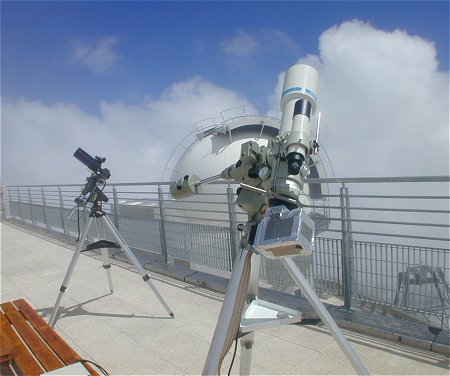
First plan, the Spectr'Aude at focus of the FSQ-106 refractor. At second plan, the ETX90 telescope used for direct imagery of the comet.
11 July 2001 Observation
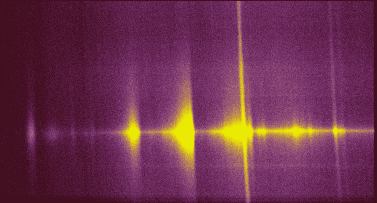
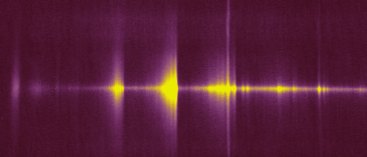
Above, the two-dimensional spectrum image of the comet C/2001 A2 after 1 hour 37 minutes exposure (composite of 97 exposures of 60 seconds each) from the Pic du Midi Observatory the 11 July 2001. Instrument: 4.2 inch refractor (Takahashi), Spectr'Aude spectrograph (sampling of 8A/pixel), Audine CCD camera (KAF-0401E) and GP-DX mount.
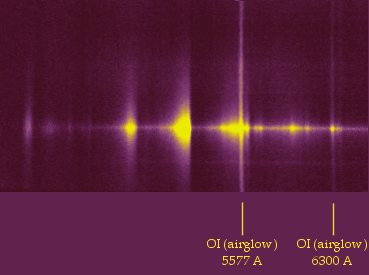
The spectrum after geometric correction: tilt of the dispersion direction and slant of spectral lines. Telluric airglow lines are visibles (atomic oxygen) at 5577.35 Angstroms and 6300.23 Angstroms. The OI line at 6363.88 Angstroms is also weakly visible.
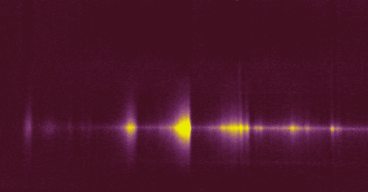
The spectrum after a
tentative subtraction of the sky background. The telluric lines
have disappeared. Note the presence of OI line at 6300 Angstroms
in the comet spectra : this spectral signature is effectively intrinsic
to this object.
Spectral profile of the nucleus region
(click on the image for enlarge). The horizontal axis denotes wavelength
(angstroms) and the vertical is in units of relative flux. This
spectra is corrected from the instrumental responsivity (the later is computed from the observation
of stars of known spectrum). The sky background is also subtracted.
Bands of C2 and C3 can be seen and also, the CN emission (cyanogen)
at 3880 A (thank to the blue response of 'E' series Kodak CCD).
The principal molecular bands in comet spectra are CN at 3880A,
C3 at 4056A, C2 at 4380A, C2 at 4738A, C2 at 5165A, C2 at 5635A,
C2+NH2 at 6100A, [OI]+NH2 at 6300A.
Above, detail of the spectral range 4000 A
- 6500 A. Click on the image for enlarge.

Spectra for three regions
of the comet: centered on the nucleus, internal coma and external
coma (see direct image below). The sky background is not removed
(note the presence of the intense 5577 A atmospheric airglow line).
The spectra are normalized for the continuum region between 5220
A and 5260 A. Full spectral domain range. Click on the image for
enlarge.
Detail of 4000 A - 6500 A spectral range.
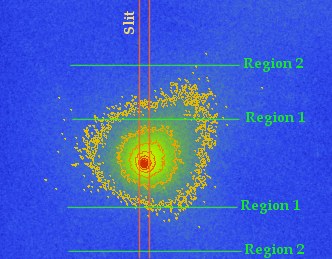
Direct image obtained by Valerie Desnoux at Pic du Midi Observatory with an ETX90 at the same time of the spectra acquisition. The exposure time was 240s, cumulated. The field represented is of 16x13 arc minutes and the north is left. The comet is in quiet state at that moment. The red vertical lines figure the projected slit. Green lines correspond to the position where the coma spectra were taken.
13 July 2001 Observation
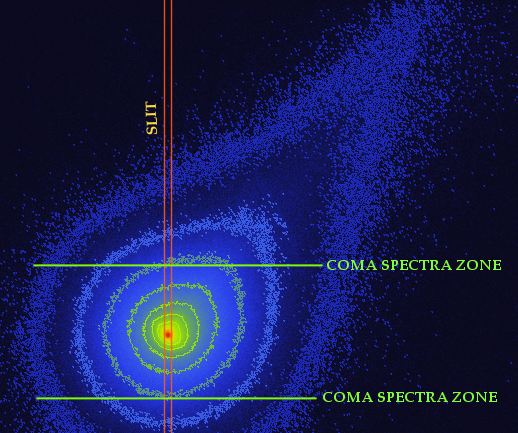
Image of comet C/2001 A2 recorded from the
Pic du Midi Observatory by Valerie Desnoux at the same time of acquisition
of the spectra below, with an ETX telescope and an Audine KAF-1602E
CCD camera. At this date, 13 July 2001, the comet is in great outburst
regime (compare with the 11 July image). The integration time is
13 minutes. The north is right and the field of view represented
here is 26 x 21 arc minutes. The projected spectrograph slit trace
is figured in red (about 20 arc-seconds wide). The two green marks
represents the position of the spectrum of the coma. For more images
see Valerie's site.
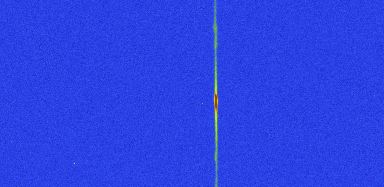
Image of LINER A2 through the narrow slit of the spectrograph (width of about 50 microns, equivalent to 20 arc-seconds on the sky). This is the zero order image of the spectr'aude spectrogaph. The comet nucleus is carefully centered in the slit during the acquisition.
The spectrum taken the 13 July
2001. This is the result of 50 x 120 seconds exposures (1h40m total
integration time).
The spectral profile for the nucleus and the coma region. The mean spectral resolution is estimated to 25 A.
Spectral range 4000 A - 6500 A.
Detail of the 4000 A - 6500 A spectral domain.
Tentative of deconvolution of the nucleus spectrum (Vancittert algorithm).The spectral resolution is now estimated to 30 Angstroms. Click in the image for enlarge.
Comparison of 11 July and 13 July spectra
The 11 July the comet is in quiet state. The 13 July is in outburst state (increase of the apparent magnitude of most one magnitude). The cause is a probable fragmentation of the nucleus.
The 13 July show a significant increase in the coma of gaz level relative to the continuum background (reflection of sun light). For a fine comparaison note that the 13 July spectra are slightly more resolved than the 11 July spectra.
Click on the images for enlarge.
Full spectral range and details.
Coma region spectra: full spectral
range and details.
