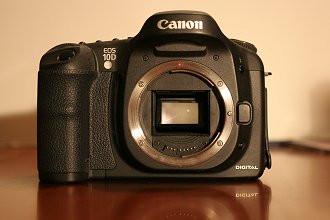
The
EOS 10D
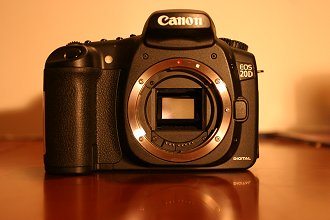
The
EOS 20D
Canon EOS 20D
vs Canon EOS 10D
and
comparison with
Canon 10D / Canon 20D / Nikon D70 / Audine
Part 1 : Canon 10D / 20D comparison
Comparison of the DSLR Canon EOS 20D and
the DSRL Canon 10D in the field of astronomy and faint detection flux. Only
the optoelectronic point of view is analysed.
Notes:
The two DSLR are measured during the
same run (16 November 2004).
The image are acquired in the RAW format.
The
telescope used for star images is a refractor Takahashi FSQ-106 (106 mm
aperture - 530 mm focal length - a razor blade fluorite instrument).
The
sky is very polluted (suburban condition).
The images are processed and analysed
with Iris software.
The signification of ADU is "Analog Digital Unit"
i.e. the "digital count" at the output of the camera.
|
|
|
DETECTIVITY
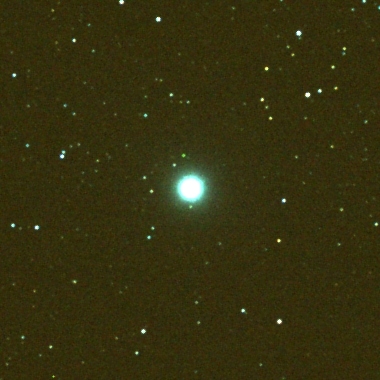
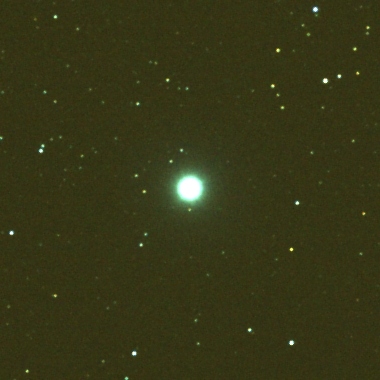
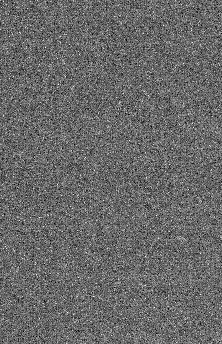
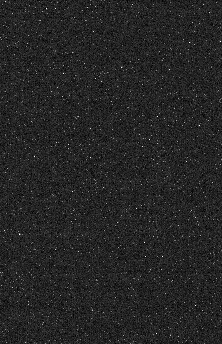
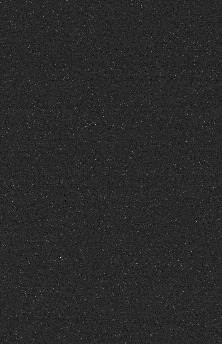
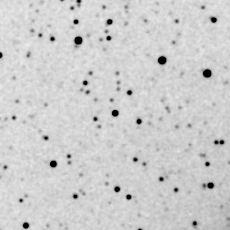
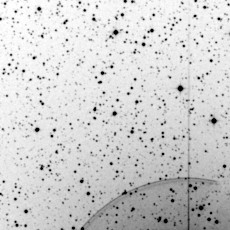
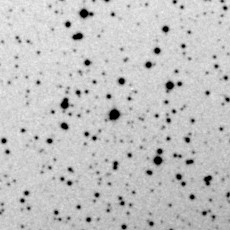
Below, crops of the Gamma Cas star field (only a very small part of the full frame is showed at the original scale). No white balance applied ("natural" color of the RAW images). Offset and thermal signal is subtracted. The flat-field correction is not realized. The visualisation parameters are the same for the two DSLR.
|
|
|
Comment: the ESO10D image is clearly more noisy. But, for an objective comparison, it is important to consider the relative sensitivity of the two camera. Measure of the signal on the sky background, on defocused stars and on white uniform screen (sun light) shows a sensitivity gain of 1.41 for the 10D comparatively to the 20D. So, the photon noise in the sky background of 10D is significantly increased.
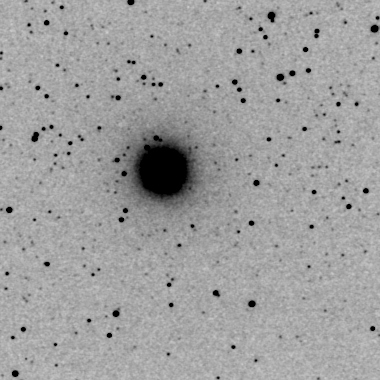
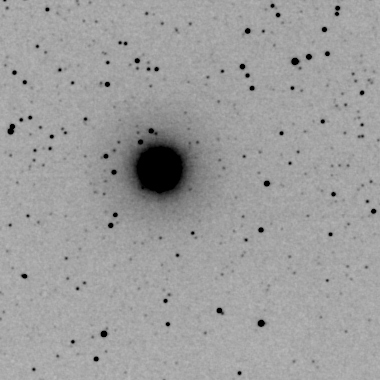
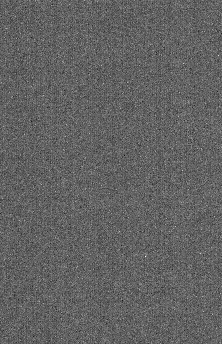
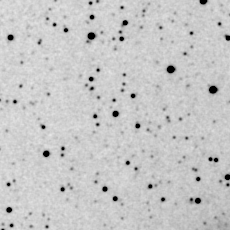
The difference aspect of the 10D and 20D is confirmed in the documents below. The RGB channel are equaly added for produce a black & white image. The 10D image is more boosted (see halo around Gamma Cas) but also more noisy.
|
|
|
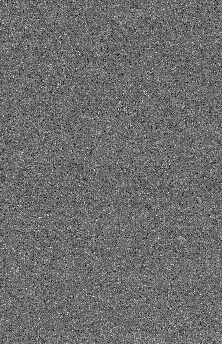
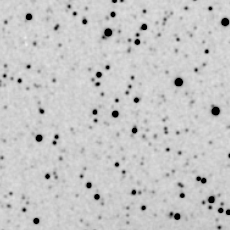
A more pertinent criteria for the detectivity consist to rescale at the same sensitivity the two images. Now it is possible to appreciate the true signal to noise ratio of the images. It is the important test:
|
|
|
Comment: The resolution gain of the EOS 20D is evident (remember, pixel size of 6.4 microns and 7.4 microns respectively for the 20D and the 10D). The detectivity is also sligthly better for the EOS 20D, but for a part, because the increased resolution (better sampling of the stars).
INTRINSIC NOISE
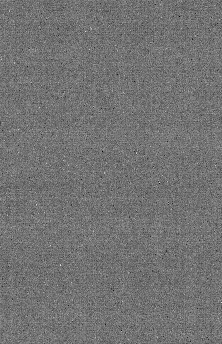
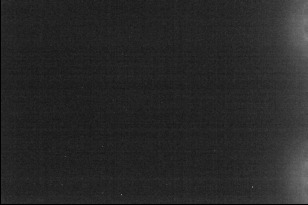
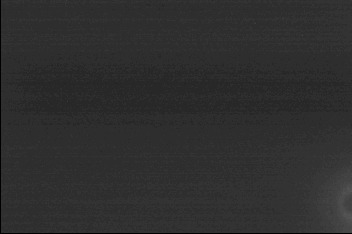
Below, short exposure in the darkness (same visualisation condition):
EOS 10D
|
|
|
|
EOS 20D
|
|
|
|
Histogram distribution of intensities in the bias
|
|
|
Comment: The noise is very gaussian for the two DSLR (a good new!). The measured RMS noise for the EOS 10D bias is 6.2 ADU (ISO 400). The measured RMS noise for the EOS 20D bias is 2.4 ADU (ISO 400). The apparent noise of the 20D is significantly lower (evident on the images). But, the electronic gain is not similar (transfer curve method evaluation on flat-field images): 2.4 electrons/ADU for the EOS 10D and 3.1 electrons/ADU. Finally the true readout RMS noise is 6.2 x 2.4 = 14.9 electrons for the EOS 10D and 2.4 x 3.1 = 7.4 electrons for the EOS 20D.
The intrinsic noise of the EOS 20D is 14.9 / 7.4 = 2 time lower comparatively to the EOS 10D. It is a major difference between the two cameras and the EOS 20D is here the winner (improved CMOS detector and/or video electronic chain).
For the two DSLR the fixed pattern amplitude in the bias is very low: 1 pixel RMS.
THERMAL SIGNAL
|
|
|
Histogram distribution of intensities in the bias frame and dark frame
|
|
|
The thermal signal of the CMOS detector
for the two cameras is definitively very small... and the performance is in
progress for the EOS 20D! The dark signal is estimated 3 times lower for
the 20D in ADU. If we take into account the gain difference of the two cameras,
the thermal signal (in electron unit) is nearly two time lower for the
EOS 20D comparatively to the EOS 10D.
AMPLIFIER GLOW
Higth contrast view of the reduced full frame (note the format difference):
|
|
|
CONCLUSION
|
|
EOS 10D |
EOS 20D |
|
Image format |
3072 x 2048 pixels |
3504 x 2336 pixels |
|
Pixel size |
7.4 microns |
6.4 microns |
|
Electronic gain @ ISO 400 |
2.41 electrons/ADU |
3.14 electrons/ADU |
|
Readout noise in ADU @ ISO 400 |
6.2 ADU |
2.4 ADU |
|
Readout noise in electrons @ ISO 400 |
14.9 electrons |
7.5 electrons |
|
Relative parasitic thermal signal per pixel |
2 |
1 |
|
Relative responsivity for extended objet in ADU |
1.41 |
1 |
|
Relative responsivity for extended objet in electron |
1.07 |
1 |
The EOS 20D is an improved version of the EOS
10D. The major gain is a lower intrinsic electronic noise. This progress compense
the lower sensitivity induced by the smaller pixel size. The difference between
EOS10D and EOS20D is not considerable - the
EOS 10D remains largely a very
powerful and competitive camera today. Dark signal of the 20D is reduced to 50%
(for the tested model). The resolution gain of EOS 20D will be notable only if it is possible to use high
qualities optics (for example short focal length fluorine refractor or very good telephoto
lens like the Canon EF 400 mm
L).
Part 2 : Detectivity of the EOS 10D / 20D, Nikon D70 and Audine CCD camera
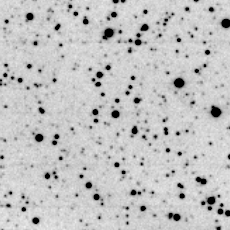
The same field is observed with the DSLR Canon EOS 10D / 20D, Nikon D70 and the CCD camera Audine. The cumulative exposure time is identical. The telescope is a Takahashi refractor FSQ-106 (4-inch aperture). Images taken the 23 Nov. 2004 (presence of a large moon and polluted sky condition).
For the DSRL images, the ISO setup is 400.
A simple linear interpolation is used for convert the CFA matrix to a RGB image.
The black and white images are computed by adding the Red, Green and Bleue channel.
The IR-cut (and antialiasing) filter of the Nikon D70 is removed (click here for details). Note the potential excess of IR signal (a superior number of red and IR photons are captured). The MODE 3 of the D70 is used ("true" RAW images).
The EOS 10D image is unfortunately very slightly out of focus (not critical for signal evaluation).
The AUDINE camera include a Peltier cooled CCD Kodak KAF-0402ME (one of the better CCD detector available for amateurs). The pixel size of KAF-402ME is 9 microns. The performance of AUDINE camera is very nearly similar to a SBIG ST7ME camera for example.
The images are scaled to the EOS 20D grid.
The detectivity estimation is biased by the difference of spectral response of the cameras (pixel RGB filters for 10D / 20D, pixel RGB filters for the D70 but a clear IR transmission, unfiltered full Si spectral range for the AUDINE), but the comparison is representative and significant if the goal is only the detection of the faintest objects and not a phometric use.
|
Canon EOS 10D |
Canon EOS 20D |
Nikon D70 |
Audine |
|
|
|
|
|
|
Exposure : 3 x 120 sec. = 360 sec. |
Exposure : 12 x 30 sec. = 360 sec. |
Exposure : 3 x 120 sec. = 360 sec. |
Exposure : 3 x 120 sec. = 360 sec. |
Below, the localization of the field on a POSS2 image (Palomar Observatory Sky Survey - Red plate). The central star is GSC 4017:531 at AD 0H56M13.0s, DEC +60°34'44" (M=11.6).
|
Scaled POSS Red (the halo is from Gamma Cas) |
Original scale of the POSS Red |
|
|
|
The table below give the typical relative signal in ADU measured from 10 stars of the field (integrated signal measured from the fit of star's PSF) for the same integration time:
|
|
Canon
EOS 10D |
Canon
EOS 20D |
Nikon
D70 |
Audine |
|
Sadu |
1.62 |
1.00 |
2.95 |
9.68 |
The measure is characteristic for a "mean" star spectral type (G type ?).
We compute now the term Q, proportional to the detector Quantum Efficiency. If g is the electronic gain in electrons/ADU, we have :

|
|
Canon
EOS 10D |
Canon
EOS 20D |
Nikon
D70 |
Audine |
|
g |
2.41 |
3.14 |
2.98 |
1.97 |
|
Q |
1.24 |
1.00 |
2.80 |
6.07 |
In most general case, for deep-sky imagery the dominant noise come from the background sky (it is particularly true during this test - moon light + city light). So, for compute the limit magnitude we are not concerned with the intrinsic detector noise (the Read Output Noise).
For the sky-limited case and for a same signal to noise ratio , the detectivity difference in magnitude for the instrumental configuration (1) and (2) is given by (see for example Astronomical Optics, D. J. Schroeder, 1987):
where  is the system transmittance,
t
is the total exposure time, D
is the telescope diameter, p is the pixel size and Q
is the quantum efficiency (the relative value of Q can be used).
is the system transmittance,
t
is the total exposure time, D
is the telescope diameter, p is the pixel size and Q
is the quantum efficiency (the relative value of Q can be used).
For the present evaluation the terms  , t
and D
are identical for all the configurations. The table below give the
pixel size:
, t
and D
are identical for all the configurations. The table below give the
pixel size:
|
|
Canon EOS 10D |
Canon EOS 20D |
Nikon
D70 |
Audine |
|
p |
7.4 |
6.4 |
7.8 |
9.0 |
Finally, the computed difference of detection limit referenced to the Canon EOS 10D is:
|
|
Canon
EOS 10D |
Canon
EOS 20D |
Nikon
D70 |
Audine |
|
|
0 |
0.05 |
0.38 |
0.66 |
For example, for the same instrument, the same sky and the same exposure, the Audine camera can detect stars fainter by 0.66 magnitude compared to the EOS 10D. The EOS 10D and EOS 20D give very similar results, confirmed by the aspect of the deep-sky images. The unfiltered Nikon D70 is attractive for faint detection, and we have also a true "black&white" camera for wavelength upper to 800 nanometers (RGB filters are transparent in infrared). The unmodified D70 is not specifically tested during this run but its response is equivalent to the Canon EOS 10D (click here for details).
Complement : How to compute the photon transfer curve and the electronic gain ?
Note: The procedure is illustrated by the Iris software commands but other software have similar function.
(1) Take two successives images of a white screen (same exposure) - here a from a Nikon D70 (the dusts are not important !):
|
|
|
(2) Subtract the bias of each image (normally constant - the mean level in the darkness). For example OFFSET -45, if the mean bias level is of 45 ADU.
(3) Extract the green channel information only: command CFA2GREEN2
(4) Evaluate the median intensity of the images in the central region: Select the region, Contextual menu, Statistics command and Median result. Use an area if 50x50 pixels for exemples. Suppose the result S = 1433 ADU.
(5) Compute the difference of the two images: SUB IM1 IM2 1433
![]()
(6) Evaluate the standard deviation of the central region: Select the region, Contextual menu, Statistics command and Sigma result. Suppose the result 29.03 ADU.
(7) Divide the standard deviation by 1.414 (i.e.
 ), this give the noise of one image. Here 29.02 / 1.414 = 20.53.
(8) Compute the variance V = 20.532 = 421.
(9) Compute the caméra gain g = S / V = 1124 / 421 = 2.67 electrons / ADU
(10) Plot the curve V=f (S) for many value S. It is the transfer curve. The inverse of the slope is the camera gain g. The variance at the origin give the square of the camera noise in ADU. Example for the Nikon D70:
![]()
The final electronic gain of the system is  and the readout noise is
  (but, for the readout noise it is preferable to measure directly the deviation
on a bias image - the result is more precise). The transfer curve is also informative
about linearity of the electronic chain.
(but, for the readout noise it is preferable to measure directly the deviation
on a bias image - the result is more precise). The transfer curve is also informative
about linearity of the electronic chain.
The transfer curve of the EOS 10D (400 ISO) - g = 2.41 electrons / ADU - RON = 16.3 electrons:
![]()
The transfer curve of the EOS 20D (400 ISO) - g = 3.14 electrons / ADU - RON = 7.5 electrons:
![]()
The transfer curve of the Audine (KAF-0402ME) - g = 1.97 electrons / ADU - RON = 21.0 electrons:
![]()